In this section, you will learn more about debugging ANTLR
grammars in the workbench.
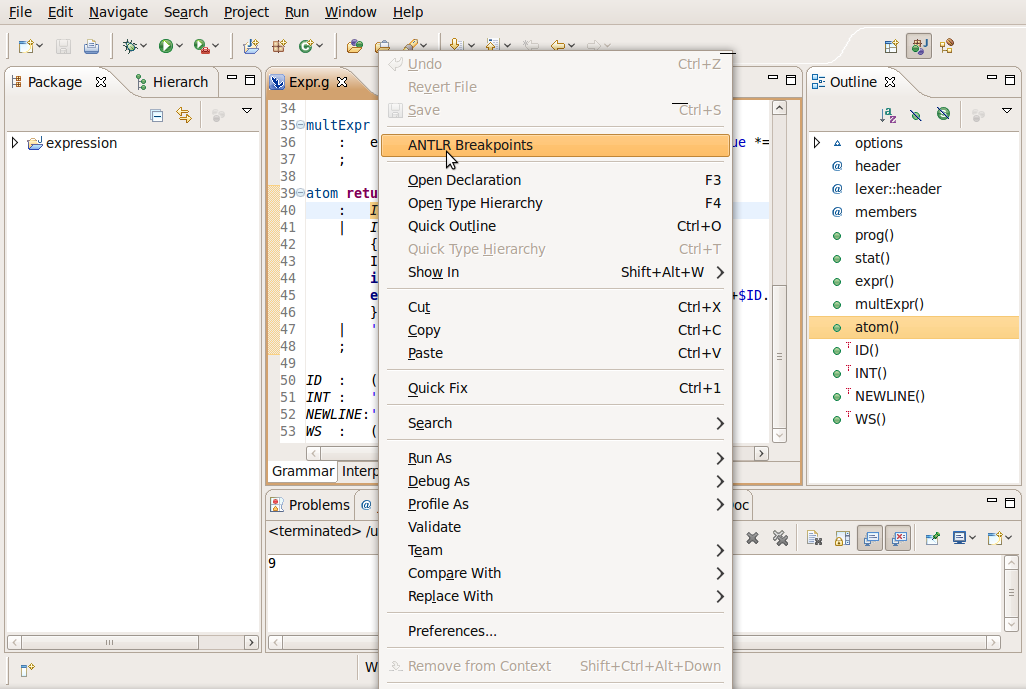
- Double click in Expr.g file to open it with the ANTLR editor.
- Select the "INT" rule inside the "atom" rule. Right click on
the rule an select ANTLR Breakpoints. Note that you
can not add breakpoints by double click.

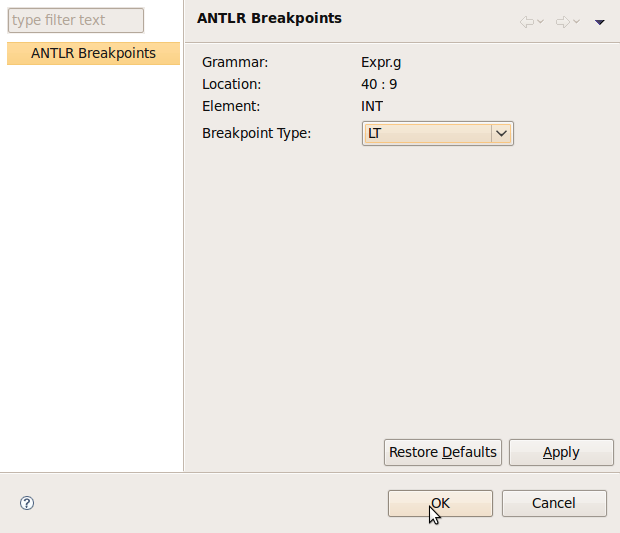
- The "ANTLR Breakpoints" dialog show information about the
selected element. In the breakpoint type list select LT
and click OK.

- The breakpoints are displayed in the vertical rule. To remove
a breakpoint you need to open Breakpoints view and
remove it from there.

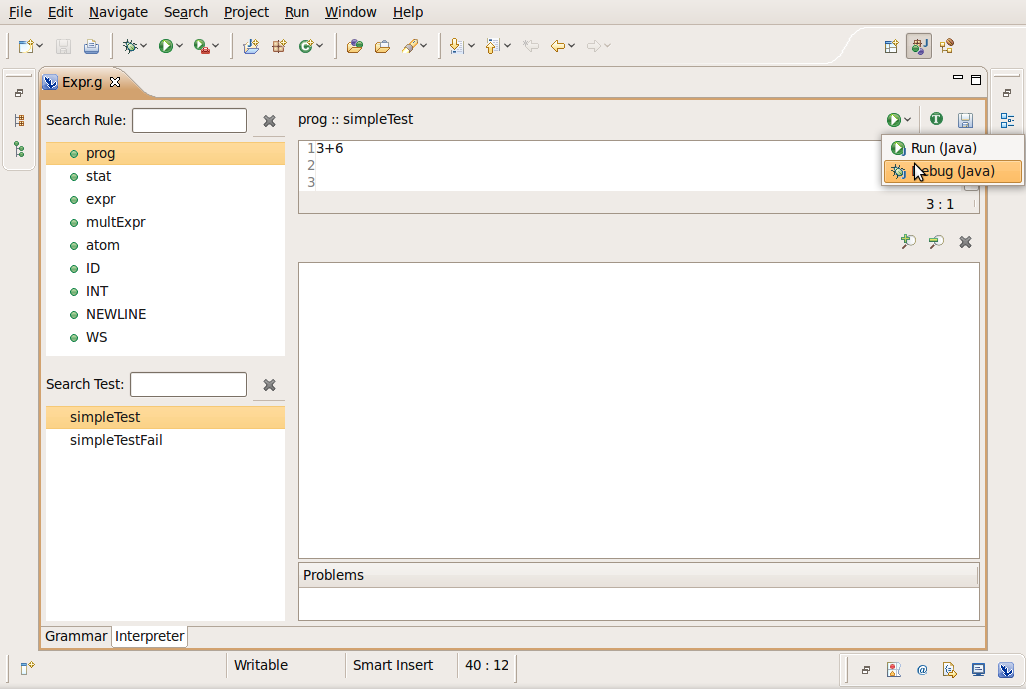
- Select Interpreter page
- Select the "prog" rule in the Rule Panel
- Select the "simpleTest" test case in the Test
Panel
- Select the "Debug (Java)" button

The "Run (Java)"/"Debug (Java)" button are available for saved
test case
You can only run/debug combined/parser grammars
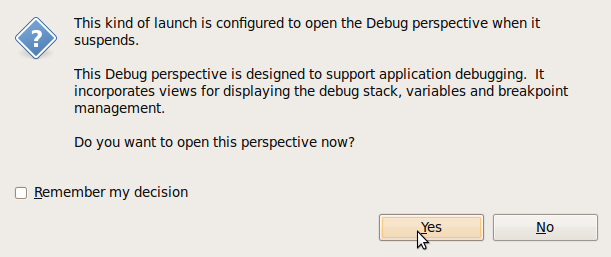
- In the Confirm Perspective Switch dialog
click Yes.

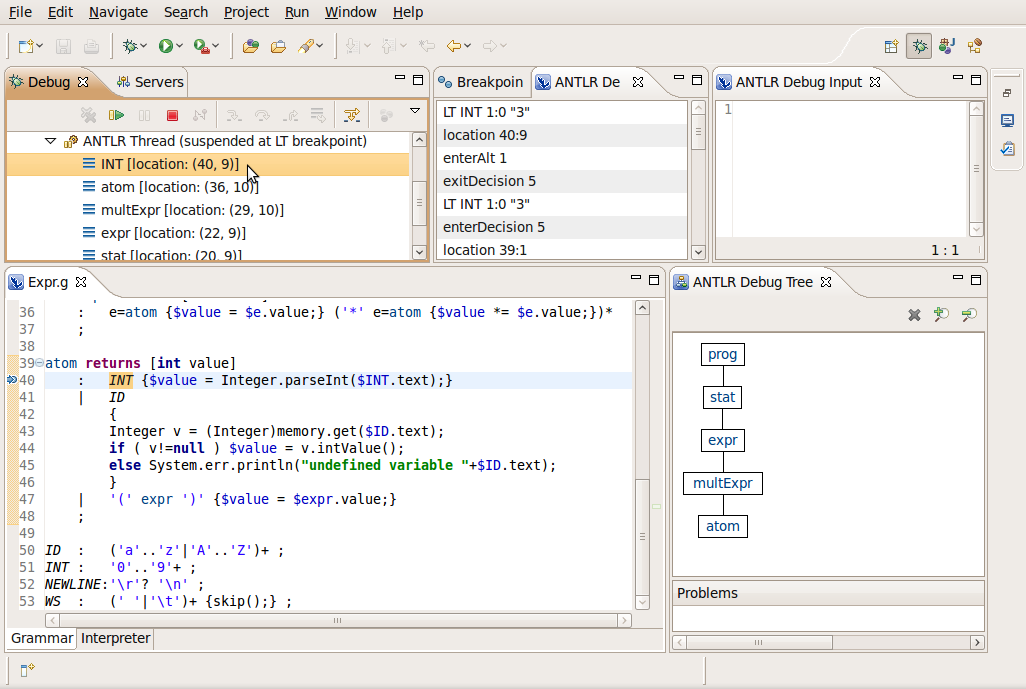
- The ANTLR debug perspective.

- Let's take a look at each view.
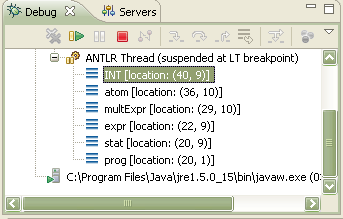
- The Debug view.

This view show the rule invocation stack to the current
breakpoint. You can click on any element to follow the invocation path
to the current breakpoint.
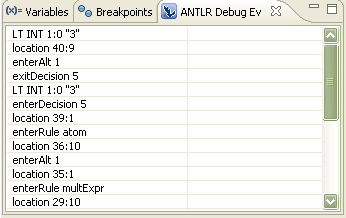
- The ANTLR Debug Events view.

This view show the debug events generated by ANTLR. The first
event (LT INT 1:0 "3") is the last event generated by
ANTLR, here you can see the next token ("3") to be consumed by ANTLR.
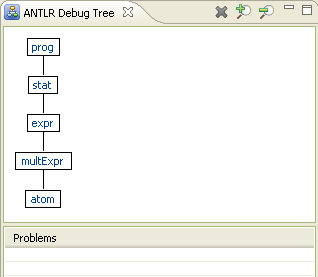
- The ANTLR Debug Tree view.

This view show a tree representation of the rules matched by
ANTLR.
- The ANTLR Debug Input view.

This view show the current input consumed by ANTLR. At this
point there is any token consumed yet. Click on the resume button on
the Debug view.

Now you can see the previous token "3" already consumed by ANTLR
and in the ANTLR Debug Events view you can see the
next token ("6") before be consumed by ANTLR.
- Click on the resume button on the Debug view
to resume the program.
- The text "9" is displayed in the Console
view.
